Data Processing & Visualization
Data Processing and Visualization for the Pipeline Corrosion Management Industry
Bitspeed Consulting Inc. offers a full-service data processing and visualization solution for companies operating in the Pipeline Corrosion Management Industry. Our solutions cover all of your data needs, allowing you to successfully capture and analyze data.
Data Processing
Our procedures help you with draft data analysis, information processing, integrated chart formulation. Combine this with our data collection solution which includes collective data conversion, information amendment, data revisions, and reverse survey segment amalgamation, and you can easily capture the data you need.
Data Visualization
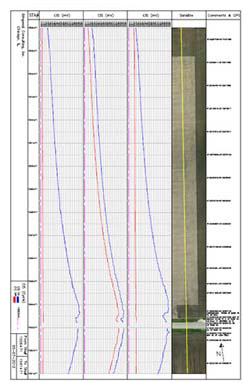
Once your data has been collected, you need to be able to turn it into information and present it in a visual manner. Our solution can help with your company chart and visualize your pipeline data and can be customized to meet your visualization needs.
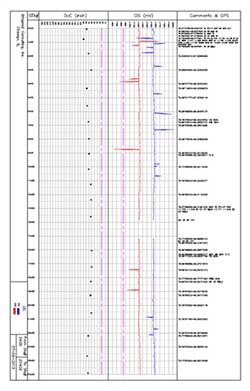
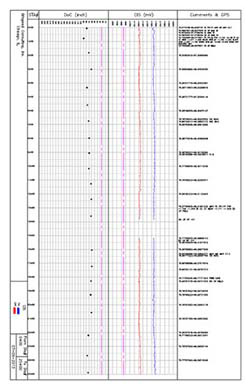
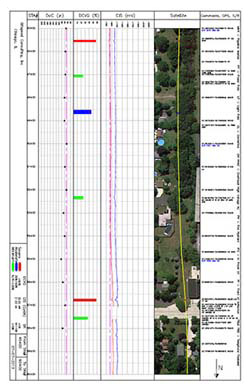
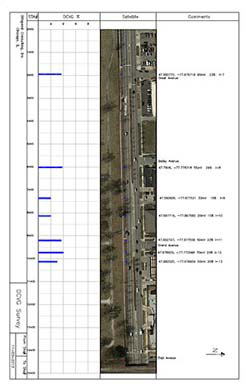
Bitspeed Consulting Inc.'s Customized charting feature can be combined with varying data survey recordings including:
- CIS
- DCVG
- DOC
- S/R
- ECDA
The charting parameters are exclusively generated to streamline client requirements and can provide daily snapshot charts to help field crews assess their progress. Bitspeed Consulting Inc.’s chart creation also integrates pipeline operations and current locations.
Looking for a complete data processing and visualization solution?
Bitspeed Consulting Inc. can help.